
Video by: Reid Havens
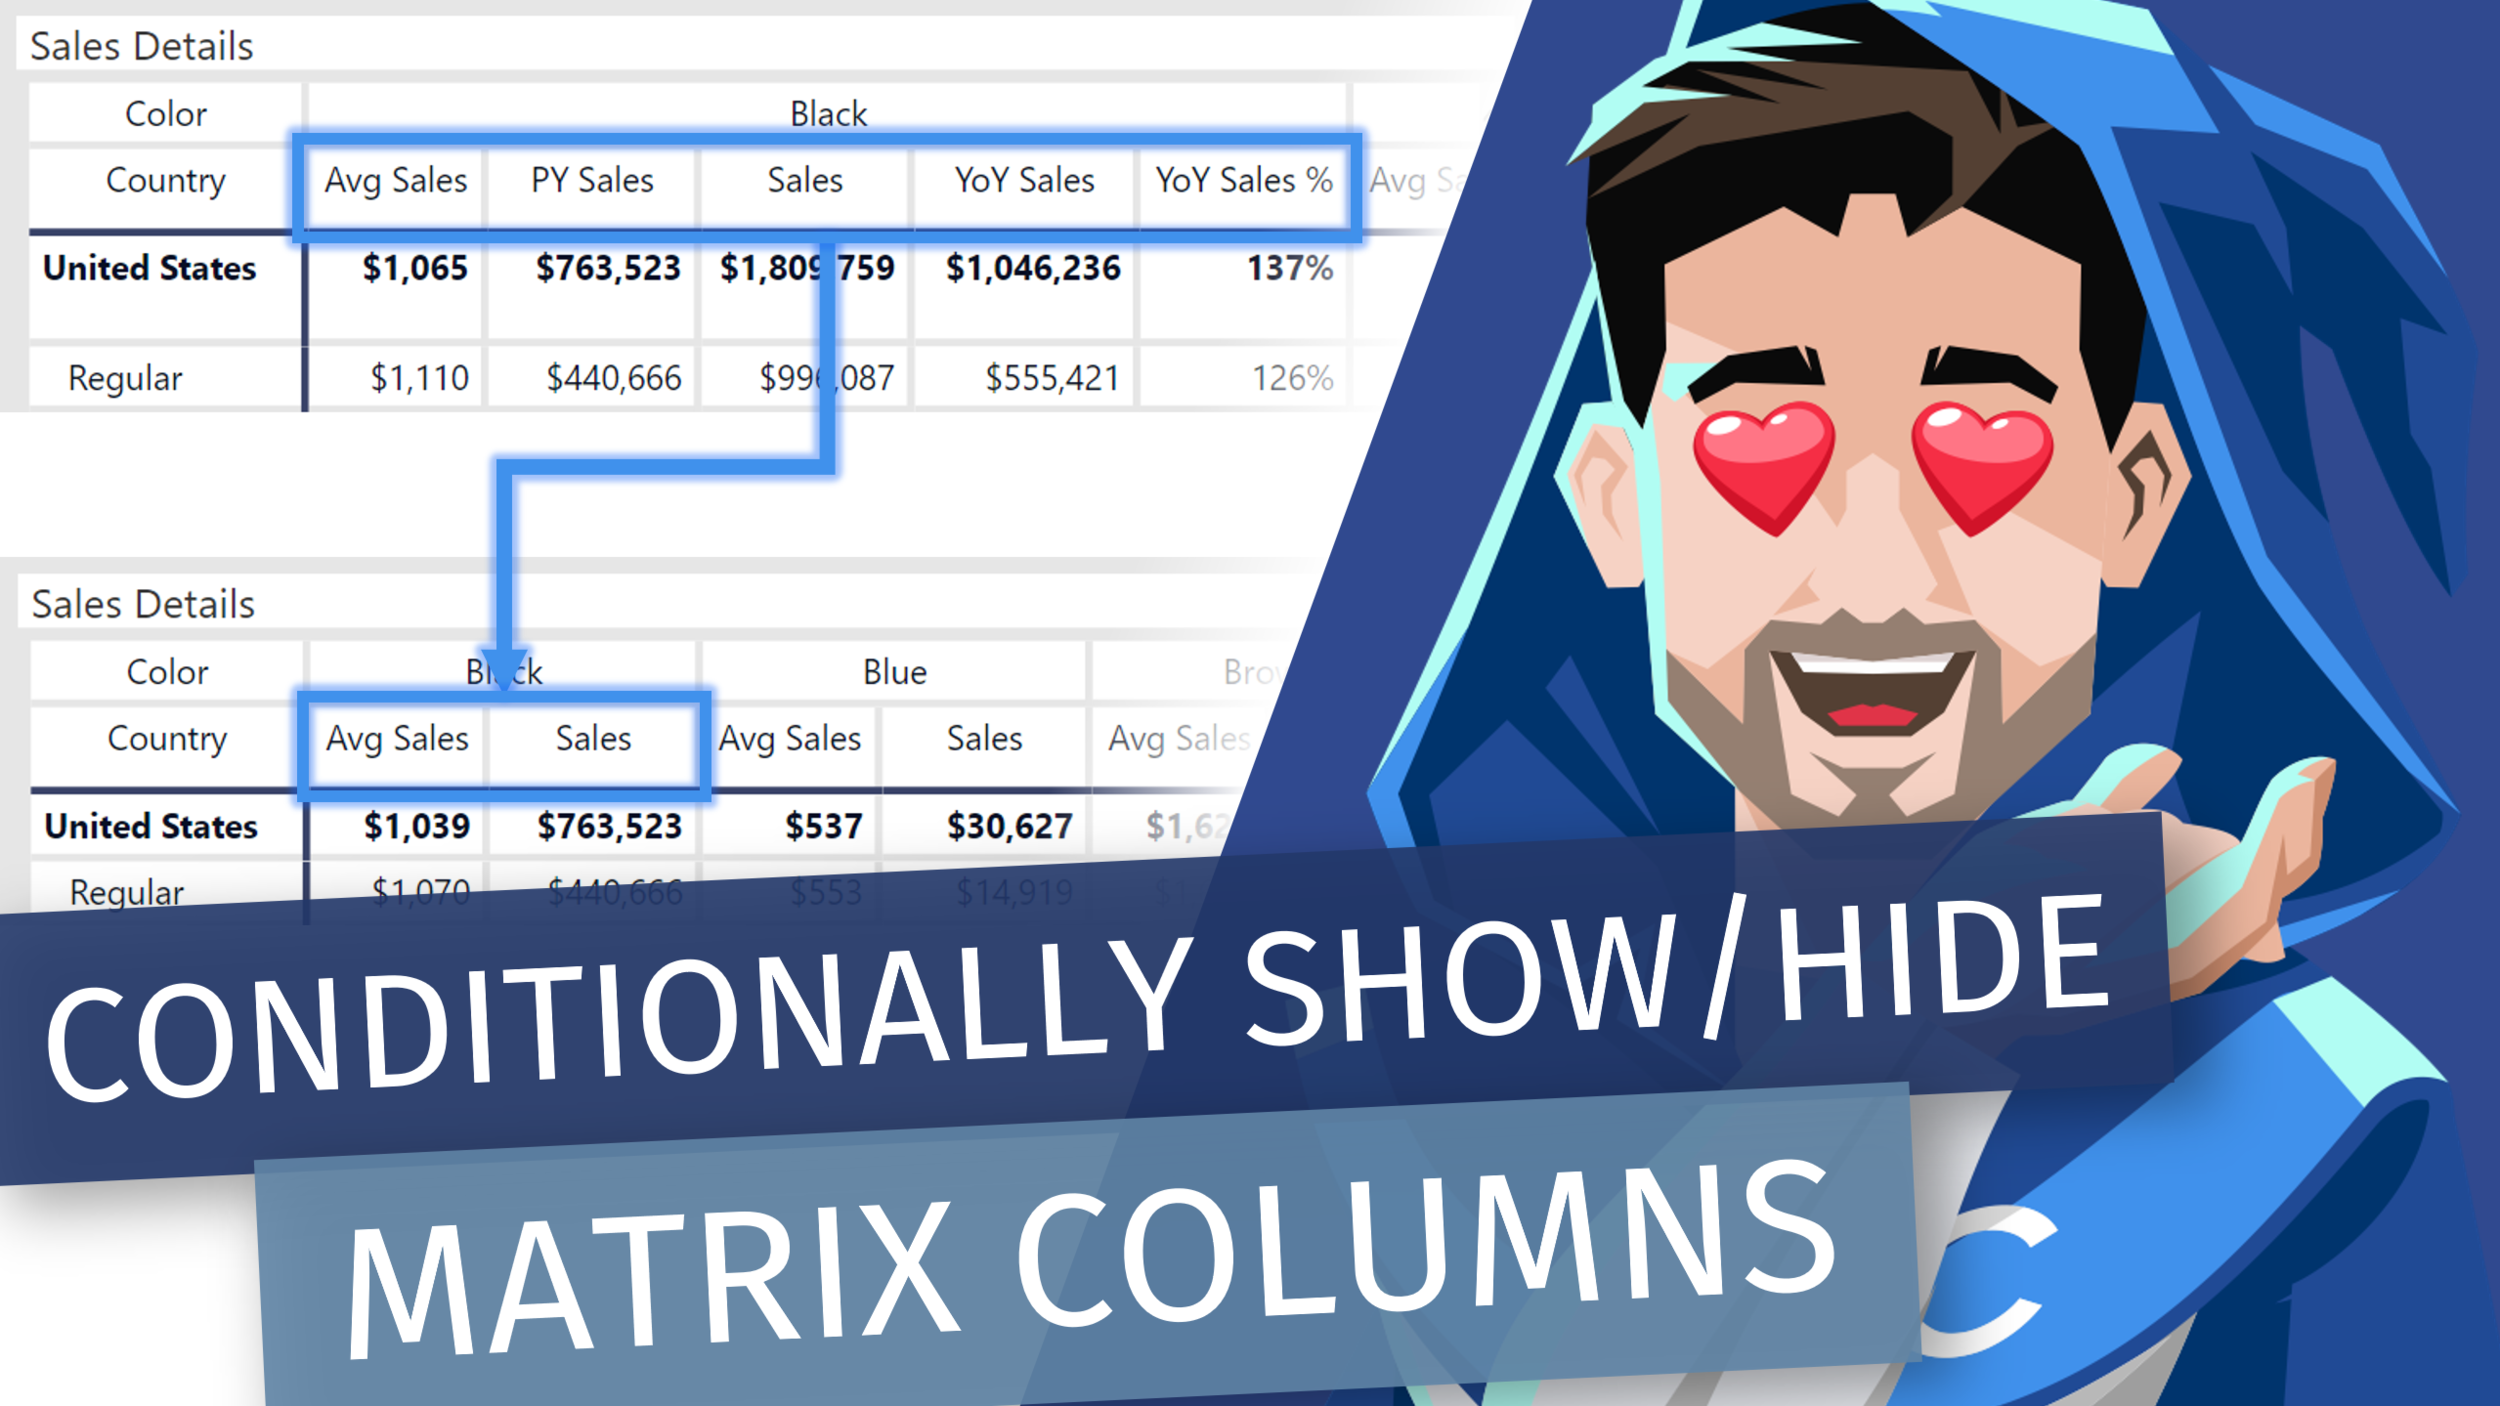
Learn yet another way to leverage calculation groups to conditionally show or hide column metrics based on either: if blank conditions, or slicer selections in Power BI.
 Havens Consulting
Video by: Reid Havens
Learn yet another way to leverage calculation groups to conditionally show or hide column metrics based on either: if blank conditions, or slicer selections in Power BI.
We recently had a look at Charticulator and how we could use it to create custom visuals that we could import into Power BI. Since then, Charticulator has been made available as a custom visual, so you can create your own designs directly inside your Power BI workbook! Daniel is back to do a recap of the basic concepts, and some more examples that demonstrate how to get started.
Come hang out as Ken Puls (Excel Guru) showcases his fantastic pro user Excel plug-in [Monkey Tools]! This tool is fantastic for helping users build better BI models for use in both Excel AND Power BI. Just SOME of the features include many "sleuthing" features to investigate and optimize parts of your model or report. One of my favorites honestly is the Dynamic Calendar Creator! Watch the stream to learn about all this and more.
Ken Puls is the president of Excelguru Consulting Inc, a company dedicated to helping users get the most from their data. A blogger, software developer, author and trainer with over 20 years of accounting and IT experience, Ken's passion lies in exploring tools to turn data into information, and teaching others how to benefit from them. Learn more about Ken at the links below!
Ken's Twitter
Ken's LinkedIn
Company Website
Company Blog
MonkeyTools
Video by: Reid Havens
Learn yet another way to leverage calculation groups to add custom multi value data labels. Plus you can even choose which data labels to display using a slicer.

Signup for our mailing list to gain access to Power BI files and templates from the videos. You’ll receive a welcome email with a link and password to the Blog Files page.
Reid Havens’ early love affair with analytics has, over the past decade, turned into an evolution into data visualization and report design in Power BI.
Since then Reid has been writing articles and creating YouTube videos to share the word of BI, helping to inspire the next generation of Business Intelligence enthusiasts.


